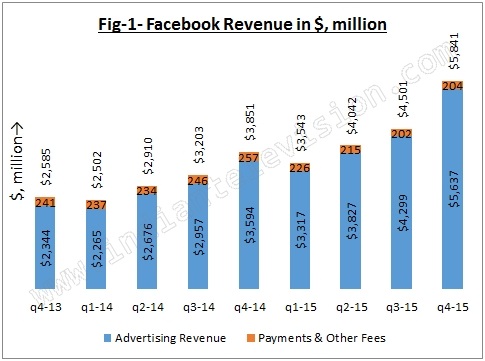
BENGALURU: Facebook reported 43.8 per cent growth in revenue for the year ended December 31, 2015 (FY-2015, current year) at $17,928 million as compared to $12,466 million in FY-2014. The company’s net income attributable to common Class A and Class B stockholders increased 25.4 per cent to $3,669 million (20.5 per cent margin) as compared to $2,925 million (23.5 per cent margin). For the quarter ended December 31, 2015 (Q4-2105, current quarter), revenue increased 51.7 per cent Y-o-Y to $5,841 million as compared to $3,851 million, while net income attributable to common Class A and Class B stockholders more than doubled (up 2.23 times) Y-o-Y to $1,555 million (26.6 per cent margin) as compared to $696 million (18.1 per cent margin).
“2015 was a great year for Facebook. Our community continued to grow and our business is thriving,” said Facebook founder and CEO Mark Zuckerberg. “We continue to invest in better serving our community, building our business, and connecting the world.”
95.3 per cent of Facebook’s revenue came from advertising in the current year as compared to 92.2 per cent in FY-2014, while the rest came from Payments and Other Fees. Please refer to Fig A below for revenue breakup in Advertising and Payments & Other Fees.
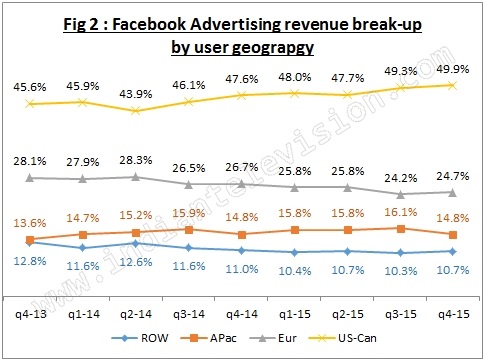
A major portion of Facebook’s advetising revenue (almost 50 per cent) comes from the US and Canada (US-Can), followed by Europe (Eur, about 25 per cent). The Asia-Pacific (APac) region contributes about 15 per cent, while the Rest of the World (ROW) about 10 per cent. Please refer to Fig 2 below for advertising revenue break-up by user geography.
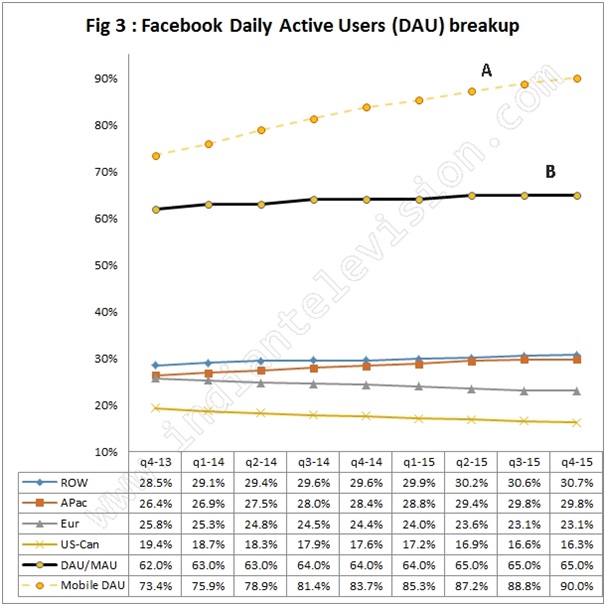
Facebook’s Daily Active User’s (DAU) in Q4-2015 increased 16.6 per cent Y-o-Y to 1038 million from 890 million and increased 3.1 per cent Q-o-Q from 1007 million. The number of Mobile DAU’s in the current quarter increased 25.4 per cent Y-o-Y to 934 million from 745 million and increased 4.5 per cent Q-o-Q from 894 million.
Please refer to Fig 3 below. Facebook has the highest number of Daily Active Users (DAU) from ROW followed by APac , Eur and US-Can respectively in terms of DAU. In other words, US-Canada and Europe’s DAUs’ which amount to about 26 per cent, contribute about 75 per cent of Facebook’s advertising revenue, and the ROW and APac’s DAUs’ contribute about 25 per cent, reflecting higher ARPU’s from US-Can, followed by Eur, APac and ROW in descending order.
The curve B in Fig 3 below signifies the ratio of DAUs’ to Monthly Average Users (MAU), while curve A indicates the percentage of Mobile DAUs’ to DAUs’.